Quantum Fundamentals: NoTerm-2022
HW 2 : Due Day 5 F 2/11
- Representations of Complex Numbers--Table
S0 4363S
Fill out the table above that asks you to do several simple complex number calculations in rectangular, polar, and exponential representations.

- Graphs of the Complex Conjugate
S0 4363S
For each of the following complex numbers, determine the complex conjugate, square, and norm. Then, plot and clearly label each \(z\), \(z^*\), and \(|z|\) on an Argand diagram.
- \(z_1=4i-3\)
- \(z_2=5e^{-i\pi/3}\)
- \(z_3=-8\)
- In a few full sentences, explain the geometric meaning of the complex conjugate and norm.
- Euler's Formula I
S0 4363S
- Use Euler's formula \(e^{i\phi}=\cos\phi+i\sin\phi\) and its complex conjugate to find formulas for \(\sin\phi\) and \(\cos\phi\). In your physics career, you will often need to read these formula “backwards,” (i.e. notice one of these combinations of exponentials in a sea of other symbols and say, Ah ha! that is \(\cos\phi\)). So, pay attention to the result of the homework problem!
Show that Euler's formula:
\[e^{i\phi} = \cos\phi +i \sin\phi\]
is true, by comparing the power series for the various terms.
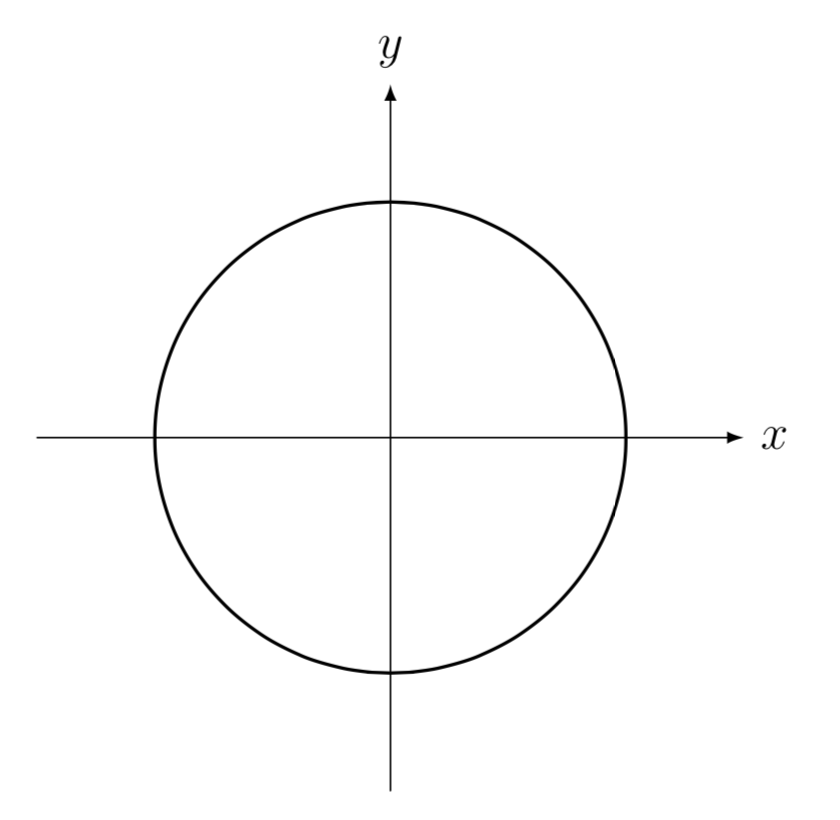
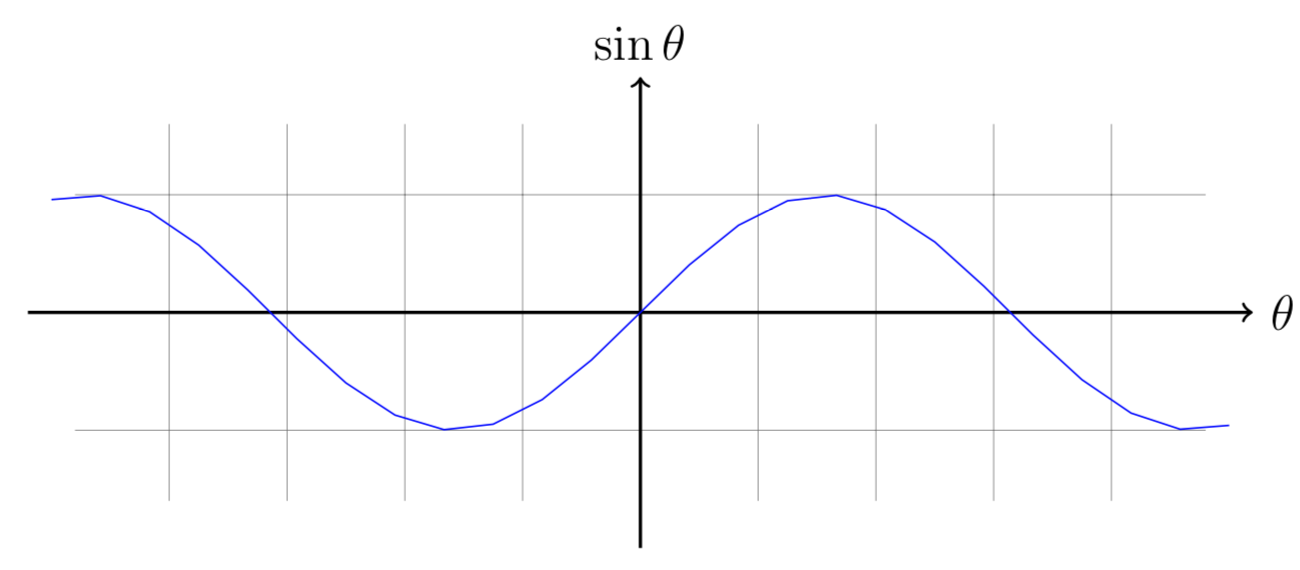
- Circle Trigonometry
S0 4363S
On the following diagrams, mark both \(\theta\) and \(\sin\theta\) for \(\theta_1=\frac{5\pi}{6}\) and \(\theta_2=\frac{7\pi}{6}\). Write one to three sentences about how these two representations are related to each other. (For example, see: this PHET)
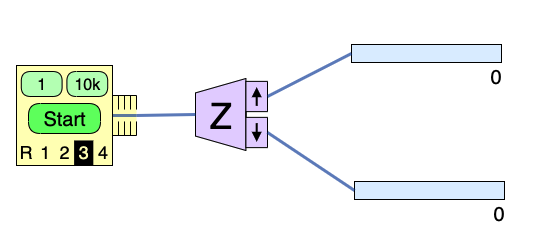
- Statistical Analysis of the Spins Sim
S0 4363S
In the spins sim, the oven can be set to emit particles in a particular unknown prepared state (instead of in a random state).
- Set the oven to Unknown #3.
- Orient the analyzer in the \(z\)-direction.
- Perform 5 sets of 10,000 Stern-Gerlach experiments (10,000 particles are sent through a Stern-Gerlach Analyzer) and record the number of particles that end up in the top counter.
- For each set of experiments, calculate the probability that a single particle was measured to have \(S_z = +\hbar/2\).
Do all of the following calculations by hand (you can use a calculator to help with the arithmetic).
Plot a histogram of the probabilities you measured for each set. Use a bin size of 0.002 for the horizontal axis. (Choose appropriate values on the horizontal axis. You don't need to plot the full possible values 0-1. You may use a computer to make the histogram or you can sketch it by hand.)
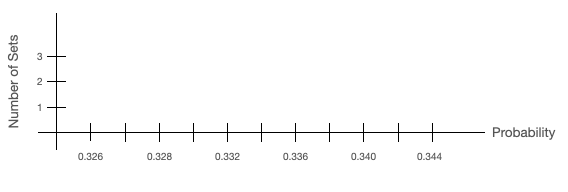
- What is your best estimate of the probability that, when you measure \(S_z\) of a particle in the Unknown #3 state, you will get a result of \(+\hbar/2\)? Mark this value on your histogram.