Translating Contours
-
Energy and Entropy 2020
Consider the following diagram of \(T\) vs \(V\) at different \(p\). The diagram illustrates the relationship between pressure, volume and temperature for an unknown substance (do not assume this is an ideal gas).
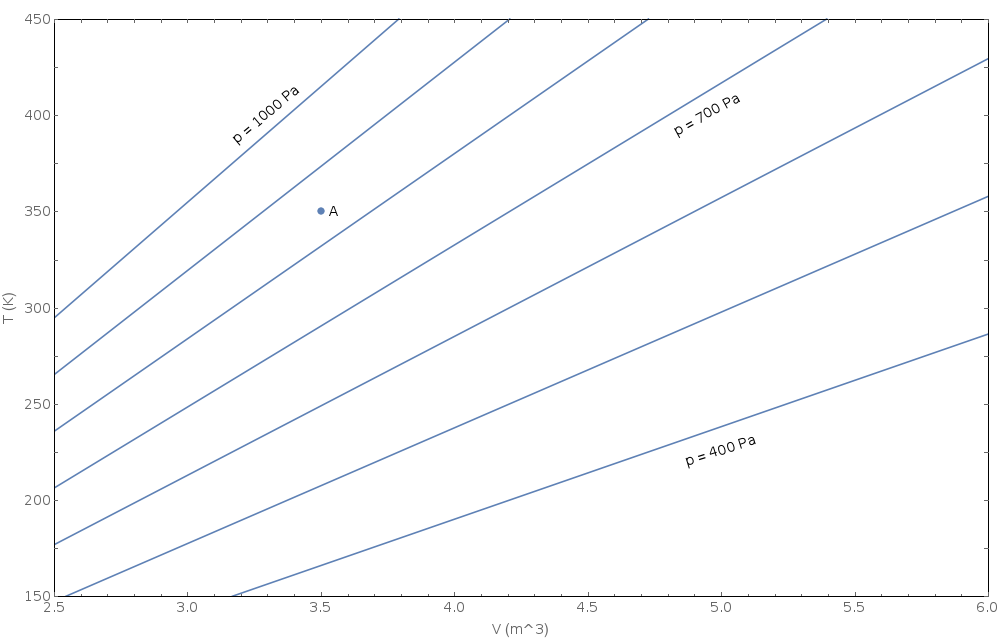
Translate the information on this diagram from the T-V plane to the p-V plane (i.e. draw contours of constant \(T\) on a graph of \(p\) vs \(V\)). Include point \(A\) on your p-V graph. Complete your graph by hand using discrete data points that you read from the T-V diagram. Make a fairly accurate sketch of the contours using the attached grid or in some other way making nice square axes with appropriate tick marks. Don't make up data for pressures above 1000 Pa or below 400 Pa.
Are the lines that you drew straight or curved? What feature of the \(TV\) graph would have to change to change this result?
Sketch the line of constant temperature that passes through the point A.
- What are the values of all the thermodynamic variables associated with the point A?